You can detect and analyze objects in images with your software. You can find an overview of the process flow of an automatic image analysis here.
Prerequisite: The automatic object analysis functions are only available when the Detection software solution has been purchased and is active.
The schematic process flow of a sample analysis
The detailed process flow of a sample analysis
See also
Tool Window - Count and Measure
Tool Window - Count and Measure Results
Carrying out an automatic image analysis
The schematic process flow of a sample analysis
A complete sample analysis is, as a rule, made up of several steps. In the following, a simplified, schematic process flow is described. In this example, gold particles are counted and classified. After each individual step in the analysis, the resulting image is shown.
A sample analysis typically proceeds in three steps.
(1) Segmenting  (2) Counting and Measuring (3) Classifying
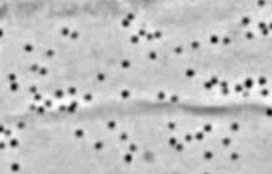
The source image: How many gold particles are in the image and how large are they?
(1) Segmenting
To begin with, the image has to be segmented. The image's foreground is separated from its background by using the threshold value setting method. All of the objects that are to be analyzed have to belong to the image's foreground. This is a prerequisite for the next step, in which the objects are measured and counted.
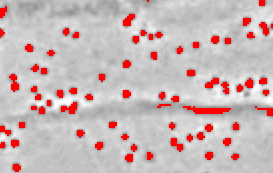
The segmented image: The gold particles are colored. This distinguishes them clearly from the background.

(2) Counting and measuring
The objects are detected, counted, and measured. For the measurement of the objects, numerous measurement parameters are available. Select the measurement parameters that interest you.
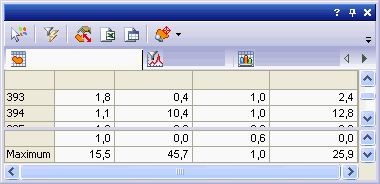
The Object Measurements results view shows the results in a table.
(3) Classifying
When the objects have been measured, they can be classified. For this purpose, a classification, in which the number and definition of the individual object classes is specified, has to be defined.
In the example, we want to group all of the objects that are actually gold particles into one class. To do this, you can define a classification scheme that allocates all round objects to one class for example.
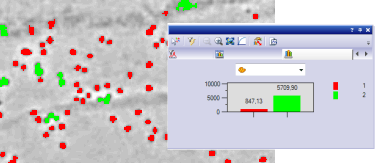
Left: The classified objects in the image, made recognizable by the allocation of different colors.
Right: The Class Histogram results view shows the results in a diagram.
The detailed process flow of a sample analysis
Not all of the steps listed below are essential. Some steps are optional, and can be carried out additionally. In the example that follows, an object analysis is described in which many of the possible steps are carried out. Normally, however, you would not carry out all of these steps, only certain ones. Steps that always have to be carried out, that's to say, those that are not optional, appear in bold format.

Processing an image with a filter
Defining a measurement parameter
Saving the image together with results and settings
Acquiring or loading an image
Acquire an image or load one. The current image is shown in the document window. All of the steps are carried out on this image.
Checking the settings
Check all of the current settings. In the Tools > Options > Count and Measure > Detection dialog box, there are some settings that have a significant influence on the results. For this reason, you should always check the settings before you begin an object analysis. You can find more information on this step here:
Options - Count and Measure - Detection
Processing an image with a filter
You can process the image with a number of filters to improve on the requirements for the automatic object analysis. Use, for example, the Separate Objects morphological filter to better separate the objects in the image. You can find more information on how to apply this filter here:
Setting threshold values
The threshold values can be set automatically or manually. Select a suitable threshold values method, for example, Manual threshold value. The image's foreground is separated from its background by using the threshold value setting method. All of the objects that are to be analyzed have to belong to the image's foreground. You can find more information on this step here:
Options - Count and Measure - Segmentation
Defining a measurement parameter
In the Select Object Measurements dialog box, select the required measurement parameters for objects. Only the selected measurement parameters are output in the results views. You can find more information on this step here:
Defining an object filter
Define which objects are to be excluded from your analysis. With the help of the object filter, you can define an individual filter range for each object parameter. Objects that don't fall within this filter range won't be shown in the results. The results only relate to the objects that lie within the defined filter range.
Defining the classification
First, define or select a suitable classification scheme. To do this, use the Options > Count and Measure > Classification dialog box. The classification scheme specifies the number of object classes and the way that they are defined.
Options - Count and Measure - Classification
Define 'One parameter' Classification
Define 'Two parameters' Classification
In the Select Class Measurements dialog box, select all of the class measurement parameters that interest you. A typical measurement parameter for classes is, for example, the number of objects per class. You can naturally also display other measurement parameters for classes, such as the area of all of the objects in a specific class.
Non classified objects are objects that aren't included in the classification. These are displayed hatched. This can, for example, happen, when a classification is used for the first time, or has to be further customized.
Defining an ROI measurement
You can limit the object analysis to certain image segments. These image segments are called ROIs (Region Of Interest). To make it possible for the object analysis to be carried out on one or more ROIs, the ROIs first have to be defined on the image. You can find more information on this topic here:
Carrying out an automatic image analysis on ROIs
In the Select ROI Measurements dialog box, select all of the ROI measurement parameters that interest you. A typical ROI measurement parameter is, for example, the number of objects per ROI. You can naturally, also calculate other measurement parameters for ROIs, such as, the area of all of the objects on a specific ROI. You can find more information on this step here:
Outputting results
Click the Count and Measure button, located in the Count and Measure tool window, to have the object analysis carried out.
The objects are detected and measured in one step. The objects are classified, and displayed in the corresponding class color in the image. Objects that don't fall within any class are cross hatched.
The default settings is the Phase classification scheme. You can define phases in the threshold dialog box. The settings that you specify there, the color of individual phases for example, are automatically adopted by the classification scheme.
The Object Count group in the Count and Measure tool window shows how many objects there are altogether, and how many of the objects lie within the filter range.
Results views
In the Count and Measure Results tool window, you can select between various results views for the display of the data. The Object Measurement results view shows the results sheet with the individual results of all of the detected objects and the statistical values.
The Object Filter results view, offers the possibility of having the histogram for a chosen object parameter displayed. This enables you, for example, to output an area distribution of the detected objects. In the area distribution you can see how many objects have a specific area. As well as that, you can view the applied filter range and the statistics for each object measurement.
The Class Measurements results view, shows the results for all of the defined classes, for example, the number of objects per class. In the Class Histogram results view, you see the class results as a histogram, for example, along the X-axis, the classes, and along the Y-axis, the area ratio per class.
You can find more information on the results views here.
Results view - Object Measurements
Results view - Class Measurements
Results view - Class Histogram
Results view - ROI Measurements
Displaying the measurement results
The measurement results will be shown in the image in a special data layer, the Detected Objects layer. Try and picture the layer as a transparency which is placed over the image. When you measure an image, the image data will not be changed by having the measurement results displayed on it.
You can, at any time, hide or show the Detected Objects layer. To do so, use the Layers tool window. There you have access to all of an image's layers. The eye icon  identifies all of the layers that are currently on display on your monitor.
Click the eye icon in front of the measurement layer to display the Detected Objects layer. Click an empty cell without an eye icon to make the corresponding layer reappear.
You can configure the display and the output of the measurement results. You can find more information on this topic here:
Options - Count and Measure - Display
Options - Count and Measure - Results
Editing the objects
In the Count and Measure tool window, you can find a toolbar with which you can deal with individual objects. You can select one or more objects, add new objects, or delete objects. As well as this, it's possible to manually or automatically separate objects that are joined together.
Saving the image together with results and settings
The image is automatically saved together with the all of the results and settings. It isn't necessary to save the results separately.
Note: Always use the TIF or VSI file format when saving an image. Otherwise you will lose most of the image information and the results during saving.
When you have analyzed and saved an image, you can restore all of the settings from the original image analysis with the Restore Options button. You can use the settings again, for the analysis of another image for example. This applies to all of the settings of the threshold value setting, detection, and classification.
This doesn't apply to the filter settings. These can be saved and loaded separately, in the Object Filter results view. Excluded are also the object, class, and ROI, parameters. These can also be saved and loaded separately.
This button is located on the Count and Measure tool window's toolbar.
Exporting data
Data can be exported to an MS-Excel table. From the Class Histogram results view, they can also be exported as a diagram. This makes it possible to save the results independently of the image and the object analysis's settings. Alternatively, you can also export the data as a TXT file, by choosing the TXT file extension when saving it.
00396 01122014