Use the ROI Measurements results view in the Count and Measure Results tool window to have the results for objects in ROIs shown. An ROI (Region Of Interest) is a certain area of an image.
Use the View > Tool Windows > Count and Measure Results command to have the tool window displayed. Should the ROI Measurements results view not yet be active, click the ROI Measurements tab to activate it.
Structure of the tool window
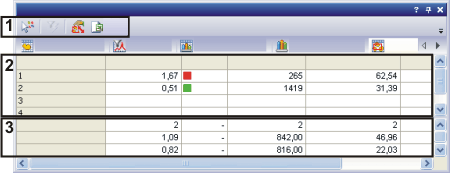
The tool window is made up of several groups. Click on one of the areas in the tool window shown schematically above to jump to the corresponding help topic.
(1) Toolbar in the results view
(3) Statistics
See also
Carrying out an automatic image analysis on ROIs
Tool Window - Count and Measure Results
(1) Toolbar in the results view


The following table lists the buttons that are relevant to the object measurements.
|
Click this button to select an individual object, or also several objects. |
|
|
Click this button to switch the current object filter on or off. |
|
|
Click this button to select the measurement parameters for the ROIs that are to be output in the results sheet. |
|
|
Click this button to export the results to an Excel sheet. |
(2) Results for the ROIs
The results for the ROIs will be output in the results sheet. The measurement results will be shown for all of the ROIs that have been defined.
The measurements take into account all of the detected objects that lie within an ROI. When you switch on the filter function, only the objects that lie within the defined filter range, will be taken into account.
Select the measurement parameter, by clicking the Select ROI Measurements button in the toolbar.
Structure of the results sheet
In the sheet's rows, all of the defined ROIs are listed. In the column's header, you'll see the name of the measurement parameter. In the cells below it, you'll find the values for the results of the respective measurement parameters per ROI.
Within a column, there is always only one unit for all of the measurement values. This unit depends on the calibration of the active image or the active layer. When you accumulate data from several images, the smallest unit from all of the images will automatically be used. You can consolidate the measurement values for all of the images that have been calibrated in the same basic unit, in meters for example. It is not possible to accumulate the measurement values of images that have been calibrated in different basic units, length and pixels for example.
The order of the columns can't be changed here. It is preset by the succession of the measurement parameter in the Select ROI Measurements dialog box, and can only be changed there.
Sorting the results sheet by a measurement parameter
You can sort the results sheet according to a particular measurement parameter. To do this, double click on the header of the column that contains the required measurement parameter. The measurement values in the sheet will then be sorted in ascending or descending order. Double click the header of the column again to sort the measurement values in the reverse order. An arrow in the header will show you the direction in which they are sorted.
Note: Class results that refer to ROIs will always be shown in the Class Measurements results view. If you, for example, want to see the area distribution of the objects per ROI, you will have to switch to the Class Measurements results view.
(3) Statistics
Below the sheet with the ROI results, you can find the sheet with the statistics. The statistics will be shown for the active measurement parameter for all ROIs. When you have chosen the Mean parameter, for example, the mean value of all of the ROIs will be shown for the active measurement parameter.
You can completely switch of the display of the statistical parameters, or also select only certain parameters. Open the Options > Count and Measure Results dialog box to make these settings.
00508 05122014