You can use an automatic image analysis to carry out numerous measurement tasks. Several typical tasks and their process flow are described here.
Prerequisite: The automatic object analysis functions are only available when the Detection software solution has been purchased and is active.
Basic functions for automatic image analysis
Measuring objects (selecting and outputting measurement parameters)
See also
Overview - Automatic image analysis
Carrying out an automatic image analysis on ROIs
Tool Window - Count and Measure
Counting objects
Task
You have an image with objects that interest you. You want to know how many of these objects there are in the image.
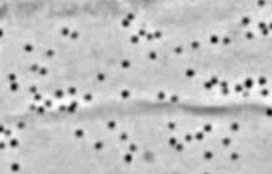
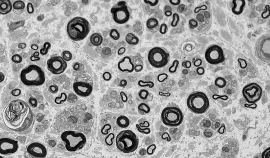
You want to detect and count gold labels on the example image.
Preconditions
The objects that you want to count must not be connected, but must be clearly separated from one another. The objects in the foreground should be optically clearly separated from the image's background. In the example image shown, the background is bright. The objects are in the foreground and are dark in color.
Preparations
1.Use the View > Tool Windows > Count and Measure command to have the Count and Measure tool window displayed.
2.Acquire an image or load one.
Setting options
3.Open the Options dialog box by clicking the Count and Measure Options  button, located in the Count and Measure tool window.
4.Select the Count and Measure > Detection entry in the tree view.
5.In the Options group, enter the value 5 in the Minimum object size field. An object must now be at least 5 pixels large in order to be counted as an object. By doing that, you will rule out the possibility that individual pixels, that may well have the same color or intensity as the objects, but don't belong to an object, are counted as objects, which would then falsify the results. This way you can exclude noise and dust particles.
6.Click OK to exit the Options dialog box.
Setting threshold values
7.In the Count and Measure tool window, click the Automatic Threshold...button to open the Automatic Threshold dialog box.
•If the Automatic Threshold button is not yet active, activate it first. To do so, select the Automatic Threshold... entry in the Threshold button's menu. You open this menu by clicking the small arrow next to the button.
•The threshold values are set automatically in the Automatic Threshold dialog box.
•All of the objects that have been detected will be displayed in color.
8.Check whether the objects have been correctly recognized.
Should the objects not have been correctly recognized, go to the Background group and enter whether the background is bright or dark.
For the image shown above, select the Background > Bright option, since the image shows dark objects against a bright background.
9.Only when the Remove Phase  button in the Phase thresholds for channel '...' group is active:
Delete all but one of the phases by continuing to click the Remove Phase button until the button becomes inactive.
10.By doing that, you will make certain that no phases from earlier analyses are still defined.
Outputting results
10.To obtain the results, click the Count and Measure button in the Automatic Threshold dialog box.
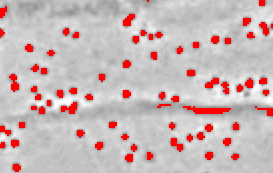
All the objects that are found are displayed in color in the image.
•The Automatic Threshold dialog box will be closed.
•The number of objects found is displayed in the Object Count group in the Count and Measure tool window.
•The objects that have been analyzed are then displayed in color, on their own image layer. This image layer is called Detected Objects. Use the Layers tool window to make these image layers appear or disappear, or to delete them.
•You can also set up your software so that it doesn't automatically output the results of the analysis as soon as the threshold value settings have been made. To do this, use the Tools > Options > Count and Measure > Segmentation command. Clear the Execute the segmentation after setting parameters check box. Then close the dialog box for setting the threshold values, with OK, and when you've done that, click the Count and Measure button in the Count and Measure tool window to have the results output.
•You can configure the software to have the Segment button displayed in the Count and Measure tool window as well. In this case, close the Automatic Threshold dialog box with OK and then click the Count and Measure button in the Count and Measure tool window.
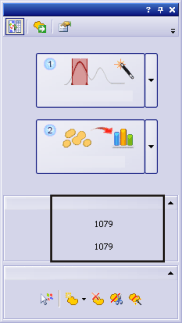
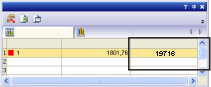
The number of objects detected will be shown below, in the Count and Measure tool window, in the Object Count group. Should you not be able to see this number, click the small black arrow to make it visible.
Separating objects
It is sometimes the case that two objects that are next to each other are not detected separately because, as far as the software is concerned, they are joined together. These sorts of objects can be separated manually.
1.Zoom into the image to enable you to better process the object.
2.Then click the Manually Split Objects  button, located in the Edit Objects group, then move your mouse pointer onto the image.
•The mouse pointer will change its form.
3.Now define a separation line through the object by clicking the left mouse button. Make sure, when you do this, that you drag the line over the object's outside edge, since otherwise it won't be separated.
4.Right click to confirm the separation line.
•The object will then be divided up into two independent objects. The results will be updated.
5.Then click the Manually Split Objects button again, located in the Edit Objects group, to leave the mode for splitting objects.
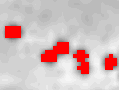
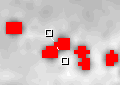
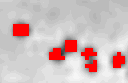
Left: Two objects are touching each other and thus are counted as a single object.
Middle: Draw a separation line through the object.
Right: The joined up object has been separated, there are now two independent objects.
See also
Measuring objects (selecting and outputting measurement parameters)
Task
You have an image with objects of different sizes. You want to know the area of the largest object and to have a close look at that object in the image. In addition to that, you want to export the results into a sheet.
Preparations
1.Acquire or load an image.
2.Carry out an automatic object analysis on the image.
Selecting a measurement parameter
3.Open the Options dialog box by clicking the Count and Measure Options button, located in the Count and Measure tool window.
4.In the tree view, select the Count and Measure > Measurements entry, then click the Select Object Measurements button, located in the Measurements group.
5.In the Select Object Measurements dialog box, add the Area and Object ID measurement parameters and close any open dialog boxes.
6.Next, in the Count and Measure tool window, click the Count and Measure button to output the results.
Viewing and sorting the results
7.In the Count and Measure Results tool window, select the Object Measurements results view.
8.The measurement values for the objects' areas are displayed in the Area column.
8.Sort the Area column to find out which value is the smallest or the largest. To do so, double click on the header of the Area column.
9.This column's measurement values will then be sorted in ascending or descending order.
9.Double click the header of the column again to sort the measurement values in the reverse order.
10.An arrow in the header will show you the direction in which they are sorted.
Object - sheet link
10.Select the largest value in the Area column.
11.The corresponding object will likewise be selected in the image window. In this way, you can easily find an object that belongs to a specific value, and view it.
Exporting the results to a sheet
11.In the Object Measurements results view, click the Export to Excel  button.
12.In the Export Object Results dialog box, assign a descriptive name to the sheet, then save it in the required directory.
Filtering objects
Objects that disturb you, or that don't interest you, can be excluded from the measurement results. All of the measurement values that lie outside the defined measurement value area, won't be displayed, nor taken into account in any of the results views.
Task
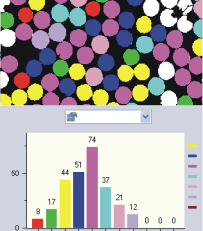
On an image with spheres of different sizes, 9 size classes are defined. You want to know how many spheres fall into which size class. When the analysis has been carried out, you discover that the number of the small spheres has been overestimated, because spheres that weren't correctly separated, were also taken into account (image on the left). Define an object filter that only counts roughly circular objects.
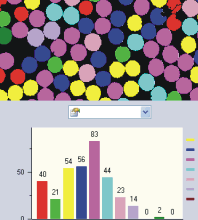
Left: At the top right of the image, you can see some spheres that weren't divided properly. They have been sorted into the class of small spheres and are displayed in red.
Right: After the definition of an object filter, the number of objects in each class has changed. In particular, the red class of small spheres now has fewer objects.
Preparations
1.Load the image you want to analyze or acquire one.
2.Carry out an automatic object analysis on the image.
3.In the Count and Measure Results tool window, switch to the Object Filter results view.
•In the table you will see a list of all of the selected measurement parameters and their corresponding filter ranges. There will always only be one measurement parameter active.
•If the measurement parameter that you want to use for the object filter isn't in the list, click the Select Object Measurements  button. You can find the button on the Count and Measure Results tool window's toolbar.
Entering the filter range directly
4.In the table, click the measurement parameter for which you want to define a filter range.
5.Double click in the [Min. field, located next to the measurement parameter to enter the lower value for the filter range.
6.Either enter the required measurement value directly, or use the arrow keys.
7.Double click in the [Max. field, then enter the higher value for the filter range.
8.The higher value itself no longer belongs to the filter range.
9.You can delete individual values by double clicking the value, then pressing the [Del) key.
Defining the filter range interactively
8.In the table, click the measurement parameter for which you want to define a filter range.
9.Click the Select minimum value  button, above the Measurement list, to define the filter range's lower value.
10.The mouse pointer will change its form.
10.Click an object whose measurement value is to be used as the lower value for the filter range.
11.The measurement value will then be automatically adopted in the [Min. field. When you, for example, define a filter range for the Area parameter, click the smallest object that you still want to measure.
12.In the image window, the result of the filtering of the objects can be seen straight away. All of the values that are outside the defined filter range will be excluded from the results.
13.The filter range contains precisely those values that are to appear in the measurement results. All of the values that are outside the defined filter range will be excluded from the results.
14.The Toggle Object Filter  button appears clicked, thereby showing you that the object filter is active.
11.If you want to undo the selection you've made, click the Clear minimum value  button.
12.Click the Select maximum value  button to define the filter range's upper value.
13.Click an object whose measurement value is to be used as the upper value for the filter range. Click the largest object that you still wish to measure.
•The measurement value is rounded up and automatically adopted in the Max.[ field. The object is still within the filter range.
Switching off the Object Filter
14.Release the Toggle Object Filter button.
Note: A defined object filter is not automatically deactivated when you load another image. If, for example, no objects are shown, make sure that the object filter is deactivated.
See also
Classifying objects
Task
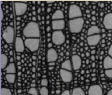
You have an image with two object classes, for example large and small. You want to know how many objects fall into which size class.
Preparations
1.Acquire an image or load one.
2.Perform an automatic object analysis on the image.
3.Select the Area object measurement.
Selecting measurement parameters for the object classes
4.In the Count and Measure Results tool window, select the Class Measurements results view.
5.Click the Select Class Measurements  button, then in the Select Class Measurements dialog box, add the Mean (Area), Object Class and Object Count measurement parameters.
•A description of the Select Class Measurements dialog box can be found here.
•With the Mean (Area) parameter, the mean area of all of the objects in a class will be calculated. That's to say, the parameter give you a measured value for how large the objects in this class are, on average.
•With the Object Class parameter, you write the name and the color of the class in the results sheet, as well. You should, without fail, adopt this parameter in the results sheet to make it possible to assign the measurement results correctly to the individual classes. You can also adopt this parameter in the Object Measurements results sheet. Then, in the results sheet, you'll be able to immediately recognize to which class each of the individual objects belongs.
•At the end, the Object Count parameter delivers the values you are looking for in the task: the number of objects found in each class.
6.Close the Select Class Measurements dialog box.
Defining classes
7.Open the Options dialog box by clicking the Count and Measure Options button, located in the Count and Measure tool window.
8.Select the Count and Measure > Classification entry in the tree view.
9.In the Current Classification group, click the New Classification  button, then select the New 'One parameter Classification' entry.
10.The Define 'One parameter' Classification dialog box opens.
10.Enter a descriptive name for the new classification in the Name field, size class for example.
11.Select the Area entry in the Measurement list.
•Only the measurement parameters that have been selected for the object analysis are shown in the list.
12.Click the Automatic Classification  button to switch to the Automatic Classification dialog box.
13.In the Automatic Classification dialog box, click the Get Min./Max. from Image button. Then the smallest and largest value of the selected parameter, that has been entered in the Minimum and Maximum fields, will be used.
•In this way, you'll be certain that all of the objects in the image can be assigned to one of the classes that have been defined.
14.Enter the value 2 in the Number of classes field, and in the Scale field, select the Logarithmic entry.
•By doing this, you have defined two size classes.
Outputting results
15.Click OK and then the Count and Measure button, located in the Define 'One parameter' Classification dialog box.
16.The classes will be displayed in the image in color. The measurement parameters that have been selected for the classes will be output in the Class Measurements results view.
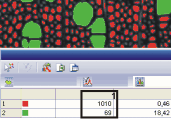
In the illustration, you can see the image with both of the size classes. The column (1) shows the number of large (green) and small (red) cells that was being looked for.
16.Close the Define 'One parameter' Classification dialog box.
•In the Options > Count and Measure > Classification dialog box, the new classification is active in the list. You can now use this classification for other analyses as well.
17.Close the Options dialog box with OK.
18.Then, in the Count and Measure Results tool window, activate the Class Histogram results view to have the class results displayed as a bar chart.
19.Select the Mean (Area) entry in the Measurement picklist, and the Class entry in the Grouped by picklist.
•Now the histogram displays the mean area of the objects for each class.
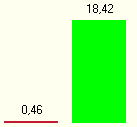
In the illustration, you see the results for the object classes in the Class Histogram results view. The mean area ratio for the object classes is displayed as a diagram. You can clearly see that the green objects are significantly larger than the red objects.
00513 19112014