Use the Define 'Two parameters' Classification dialog box to define a classification scheme for detected objects. It allows you to classify objects in an image based on two parameters that you select. An example is an image that contains bright and dark objects of differing sizes. You can define a classification scheme that classifies the objects by intensity and size at the same time.
Opening the dialog box
1.You can open this dialog box by clicking the small black arrow next to the Count and Measure button, located in the Count and Measure tool window.
2.From the button's context menu, select the Classification Options... entry to switch to the Options > Count and Measure > Classification dialog box.
3.Click the New Classification  button there, then select the New 'Two parameters' Classification entry.
The dialog box's structure
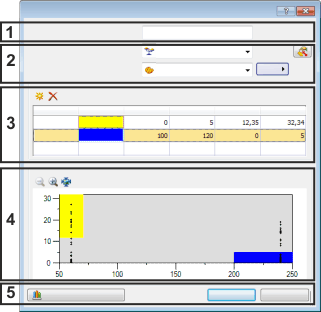
The dialog box is made up of several groups. Click on one of the areas in the dialog box shown above to jump to the corresponding help topic.
(1) Assigning the classification a name
(2) Selecting measurement parameters
(4) Scatterplot
(5) Performing a classification
See also
Overview - Automatic image analysis
Carrying out an automatic image analysis
(1) Assigning the classification a name
Enter a descriptive name for the classification in the Name field. This name will be adopted in the Options > Count and Measure > Classification dialog box's Current classification list and can then be selected for an automatic image analysis.
(2) Selecting measurement parameters
Using the picklist
Use the X-axis measurement and Y-axis measurement pick lists to select two measurement parameters by which the objects will be classified. Which measurement parameter is allocated to which axis only effects the graphical representation in the scatterplot, nothing more.
Note: Only measurement parameters that have already been entered in the Measurements computed for all objects list, located in the Select Object Measurement dialog box, may be used.
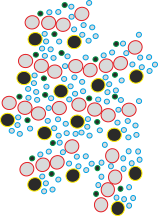
The image contains large bright, small bright, large dark, and small dark objects. Using the properties of intensity and size, they have been divided into four classes.
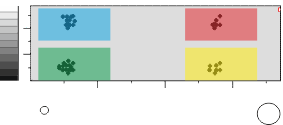
In the histogram, the object size is plotted on the X-axis. The gray intensity value is plotted along the Y-axis. The objects have been divided into four classes. The red class contains, for example, all the large bright objects.
 Adding measurement parameters that are missing
Should the required measurement parameter not yet be offered in the picklist, click the Select Object Measurements button to switch to the Select Object Measurements dialog box. There, you can add the required measurement parameter. You can find more information on this dialog box here.
Selecting a unit
Click this button  to specify the unit for the two selected measurement parameters. The button will only appear in the dialog box when the selected measurement parameter has also been linked to a unit. Some parameters, Shape Factor for example, have no unit.
Select the basic unit from the Unit menu. The button will then display the basic unit you've selected. Click the button again, and open the Prefix menu. Select the appropriate entry. The button's label will be changed correspondingly.
The selected unit has an effect on all of the values in the dialog box: On the values in the scatterplot and the limit values for the individual classes. The unit that has been chosen here, doesn't have an effect on the values in the results sheets.
(3) Defining object classes
Use the Object classes definition group to specify the number and the names of the classes. You also define the class limits for each class here.
Adding classes
Click the Add Object Class button to add another object class.
Double click the field in the Class Name column to enter a name for the class.
Double click the field in the Color column to open the color palette and to select a color for the class. The class will be displayed in the color you have assigned it, in the image window and in the histogram.
Class names and class colors can also be displayed in the results views in the Count and Measure Results tool window.
Deleting classes
Click the Remove Object Class  button to delete a class. At least one class will always be defined. It's only possible to remove a class when at least two classes have been defined.
Defining class limits
The classes are defined by the minimum and maximum values of two parameters. The upper value itself no longer belongs to the class. The values for the X-axis always relate to the measurement parameter that is selected in the X-axis measurement list and the corresponding unit. That's to say, a value of 100, corresponds with an area of 100 µm², when the Area measurement parameter and the µm² unit have been chosen.
Double click in one of the fields to enter a value for the respective class. You can either edit the value directly, or select it via the arrow keys.
(4) Scatterplot
In the scatterplot, the measurement results for the first measurement parameter are plotted on the X-axis. The results for the second measurement parameter are plotted on the Y-axis. The result is a collection of points with one point for each detected object. The scatterplot shows the correlations between the selected measurement parameters.

The color of the objects is plotted along the X-axis of the displayed scatterplot. The size of the objects is plotted along the Y-axis. In the scatterplot it can clearly be seen that there are only two colors in the image. Each color has large and small objects.
The scatterplot provides a visual representation of the defined classes. The yellow class contains the large yellow objects and the blue class contains the small blue objects. The same color has been selected for the class as for the objects.
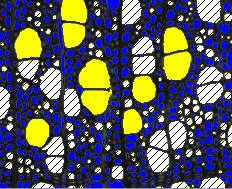
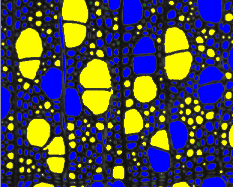
This is the resulting image from the classification of the objects using the classification scheme shown above. In the resulting image, the large yellow objects have been allocated to a class (the yellow class). The small blue objects have also been allocated to a class (the blue class). The small yellow and large blue objects are cross hatched because they can't be allocated to any class.
(5) Performing a classification
Click the Count and Measure or Count and Measure on ROI button to apply the current classification scheme. This gives you the opportunity to test the classification, and, if necessary, to adjust it.
Now click the Close button to exit the dialog box.
Click the OK button to save the current values, without performing the classification.
5822 01122014