|
|
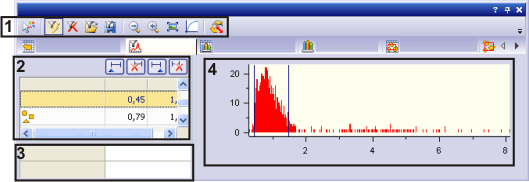
Use the Object Filter results view, in the Count and Measure Results tool window to define filter ranges for the measurement values and to thus filter the desired measurement values out. All of the measurement values that lie outside the defined measurement value area, won't be displayed, nor taken into account in any of the results views. Objects that have been filtered out won't count towards the class results, for example. This can make sense when unwanted objects are still detected after the segmentation. Use the View > Tool Windows > Count and Measure Results command to have the tool window displayed. Should the Object Filter results view not yet be active, click the Object Filter tab to activate it. Structure of the tool windowThe tool window is made up of several groups. Click on one of the areas in the tool window shown schematically above to jump to the corresponding help topic. (1) Toolbar in the results view (2) Filter ranges (3) Statistics (4) Distribution of the measurement results See also Carrying out an automatic image analysis Tool Window - Count and Measure Results (1) Toolbar in the results view
The following table lists the buttons that apply to object filters. The other buttons change the display of the measurement values in the chart.
(2) Filter rangesIn the table you will see a list of all of the selected measurement parameters and their corresponding filter ranges. There will always only be one measurement parameter active. You can either enter the filter range directly in the list or you can interactively determine it, by selecting objects in the image. Entering the filter range directly1.In the table, click the measurement parameter for which you want to define a filter range. 2.Double click in the [Min. field, located next to the measurement parameter to enter the lower value for the filter range. 3.Either enter the required measurement value directly, or use the arrow keys. 4.Double click in the [Max. field, then enter the higher value for the filter range. 5.The higher value itself no longer belongs to the filter range. 6.You can delete individual values by double clicking the value, then pressing the [Del) key. Defining the filter range interactively1.In the table, click the measurement parameter for which you want to define a filter range. 2.Click the Select minimum value 3.Click an object whose measurement value is to be used as the lower value for the filter range. When you, for example, define a filter range for the Area parameter, click the smallest object that you still want to measure. •The measurement value will then be automatically adopted in the [Min. field. 4.If you want to undo the selection you've made, click the Clear minimum value 5.Click the Select maximum value 6.Click an object whose measurement value is to be used as the upper value for the filter range. Click the largest object that you still wish to measure. •The measurement value will then be automatically adopted in the Max.[ field. 7.If you want to undo the selection you've made, click the Clear maximum value Saving and loading filter settings1.Click the Save Filter •You can find more information on parameter sets here. 2.By using the Load Filter (3) StatisticsThe results sheet with the statistics is located below the list with the filter ranges. The statistics will be shown for the active measurement parameter. If you choose the Area parameter, for example, the mean area for all found objects will be displayed. Only the values of objects within the current filter range are taken into account. Showing and hiding statistical parameterYou can completely switch of the display of the statistical parameters, or also select only certain parameters. Open the Tools > Options > Measurement and ROI > Results dialog box. You can find the statistical parameters that are available in the Statistics group. Count: number of the individual measurements Minimum: lowest measured value Maximum: highest measured value Mean: mean value of all of the measured values Standard deviation: The standard deviation is a measure for the spread of the measurement values around their mean value. Sum: the sum of all of the measurement values
If you don't want to calculate any statistics, clear all of the check boxes. The results view now only contains the table with the filter ranges. (4) Distribution of the measurement resultsOn the right-hand side of the tool window, the histogram shows the distribution of the current measurement parameter. The histogram shows the selected measurement parameter's distribution. The number of objects has been plotted along the Y-axis. The selected parameter has been plotted along the X-axis. The name of the current measurement parameter is displayed below the histogram. You can change the way the histogram is displayed, by using the zoom buttons on the toolbar. Defining the filter range in the histogramIt's easy to change an existing filter range in a histogram. The filter range is depicted with two lines in the histogram. The line on the left shows the lower limit value, the line on the right the upper limit value. 1.Move the mouse pointer onto the histogram. 2.When you move your mouse pointer onto one of the two black lines, the mouse pointer will change its shape into a double arrow. 2.Keep the left mouse button pressed. Now you can move the line and, by doing so, set a new value. 3.The filter ranges change correspondingly.
In the diagram, the line on the left shows the lower limit value, the line on the right, the upper limit value, for the filter range. Changing the display of the histogram
00505 25112014 |



 button, above the
  button.
 button to define the filter range's upper value.


