An ROI (Region Of Interest) is a certain area of an image. You can limit an automatic image analysis to a certain segment of the image. The analysis will then only be performed on this image segment. You can also define several ROIs and compare the results with each other.
Analyzing object classes on ROIs
See also
Overview - Automatic image analysis
Carrying out an automatic image analysis
Tool Window - Count and Measure
Defining ROIs
There are several ways of defining ROIs.
•Use the functions in the Count and Measure tool window.
•Convert a detected object into an ROI.
Using the "Count and Measure" tool window
1.Load the image you want to analyze or acquire one.
2.Use the View > Tool Windows > Count and Measure command to have the Count and Measure tool window displayed.
3.Perform an automatic object analysis on the image.
4.In the Count and Measure tool window, click the small black arrow next to the Count and Measure button.
5.Select the Count and Measure on ROI entry from the button's context menu.
6.The Count and Measure button is now called Count and Measure on ROI.
7.From the Count and Measure on ROI button's context menu, select the New ROI command.
8.A context menu that offers you 3 tools for the definition of ROIs, will open. You can define an ROI as a rectangle, circle or polygon. It is also possible to define several ROIs with different tools, on an image.
9.Click on a tool to select it, the Rectangle button for example, then move your mouse pointer onto the image.
10.The pointer will change its shape to a cross. The selected tool appears under the mouse pointer.
11.With your left mouse button, define the segment in the image that is to be used for the analysis. If needed, right click to confirm the ROI.
12.If necessary, define further ROIs.
13.When all of the ROIs have been defined, click the Count and Measure on ROI button to obtain the results.
Note: If the Count and Measure on ROI button has been activated, but no ROI have been defined, the automatic analysis will by performed on the complete image.
Converting an object into an ROI
You can use this method of defining an ROI when you want to analyze objects within an object.
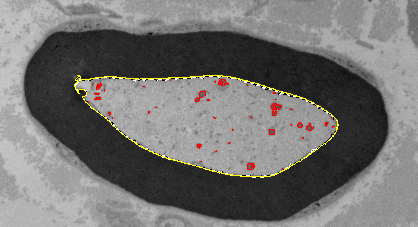
You want to analyze the objects within the black structure. Consequently the automatic image analysis has been limited to the ROI that is outlined in yellow. The objects that have been detected within the ROI are shown in red.
1.Load the image you want to analyze or acquire one.
2.Define the threshold values to include the object that you want to turn into an ROI.
•In the example shown, you can use automatic threshold value setting and select a dark background. This means that the bright image segments will be identified as objects.
Please note that the holes should not be filled by the image analysis. To do this, clear the Fill holes check box in the Tools > Options > Count and Measure > Detection dialog box.
3.Perform an automatic object analysis on the image.
4.Click the Select Detected Objects  button to switch to the selection mode. You can find the button in the Count and Measure tool window, in the Edit Objects group.
5.Select the object that you want to turn into an ROI.
6.Click the right mouse button to open a context menu.
7.Select the Create ROIs from Selected Objects command from the context menu.
8.The object will now be converted into an ROI.
9.You can find the ROI in the Measurement tool window. You can rename the ROI here. You can also save and delete the ROI.
8.Now, define suitable threshold values for the objects inside the defined ROI.
•In the example shown, now select a bright background for the automatic threshold value setting. Now, the dark objects within the ROI are identified as objects.
Analyzing object classes on ROIs
Task
You are interested in two segments and two object classes on an image.
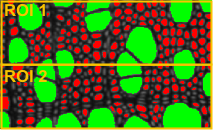
2 ROIs have been defined on the image. You want to calculate the number of large and small cells in the upper and lower area of the image and compare them to each other.
Preparations
1.Acquire an image or load one.
2.Perform an automatic object analysis on the image.
3.Select the Area, Object Class and ROI object measurements.
4.Select the Mean (Area), Object Class, Object Count and ROI class measurements.
5.Select a classification that groups all objects into two size classes.
Defining an ROI
6.Define two rectangular ROIs on the image.
Setting options
7.Open the Options dialog box by clicking the Count and Measure Options  button, located in the Count and Measure tool window.
8.Select the Count and Measure > Detection entry in the tree view.
9.In the Borders - ROI group, select the Truncate option. By doing this, you will make sure that objects that lie on the edge of the ROI are counted as well. Observe though, that the objects will be cropped. The area of the objects on the edge won't, therefore, be correctly measured. You should use this option especially when you're mainly interested in finding out how many objects are present, and are not interested in the area.
Selecting measurement parameters for the ROIs
10.Select the Count and Measure > Measurements entry in the tree view.
11.Click the Select ROI Measurements button, then in the Select ROI Measurements dialog box, add the Mean (Area), ROI and Object Count measurement parameters.


12.Close all open dialog boxes.
Outputting results
13.In the Count and Measure tool window, click the Count and Measure button's small black arrow to open a context menu. Select the Count and Measure on ROI entry there.
14.The button is now called Count and Measure on ROI. The results will be automatically output.
•The classes will be displayed in the image in color. The selected measurement parameters for the classes and ROIs will be output in the Class Measurements and ROI Measurements results views.
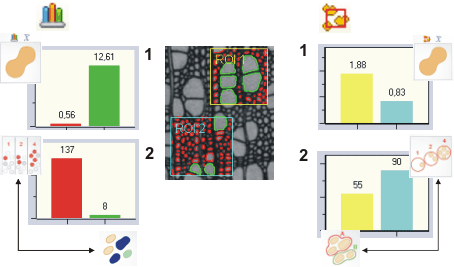
The analysis performed above, supplied numerous different results. This illustration explains some of the possible results of the analysis that was performed above.
In the image in the middle, you can see that the analysis was carried out on two ROIs (blue and yellow). In both ROIs, objects were recognized that were assigned to two size classes. The small objects are shown in red, the large objects in green.
Class measurements
The results of the class measurement are shown to the left of the image. You can find these results in both the Class Measurements and the Class Histogram results view. In diagram (1), you can see the mean area of an object for each of the size classes defined.
As can be expected, the green objects are on average, much larger than the red ones.
In diagram (2) the number of objects that fall into the green class and the red class, are shown. Clearly, there are far more small, red objects, than there are large, green ones. The class results take all of the objects into account, regardless of in which ROI they were found.
You can, however also output the class results per ROI. In this case, select the ROI entry, in the Grouped by list.
ROI measurement
The results of the ROI measurement are shown to the right of the image. You can find these results in the ROI Measurements and the ROI Histogram results view.
In the diagram (1) you can see, for each ROI, the mean area of all of the objects found in that ROI. More large, green objects were found in the yellow ROI, than in the blue ROI. For this reason, the mean area of an object in the yellow ROI is considerably larger than that in the blue ROI. The difference is, however, not so extreme as the ratio of small to large objects is.
In diagram (2) the number of objects per ROI has been plotted. There are more objects in the blue ROI than there are in the yellow one.
00356 03122014