|
Use the Count and Measure Results tool window to have the results of an automatic analysis displayed. Use the View > Tool Windows > Count and Measure Results command to have the tool window displayed. Alternatively, click the Count and Measure Results  button, located in the Count and Measure tool window's toolbar. button, located in the Count and Measure tool window's toolbar.
The tool window offers you different results views. You can obtain results as they apply to objects, object classes, or to ROIs. Some results can be displayed as a results sheet or as a histogram.
Structure of the tool window
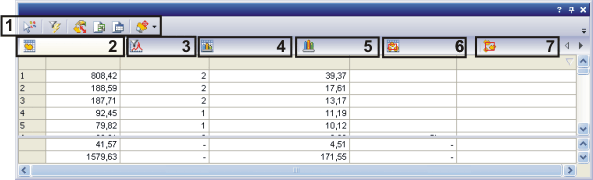
(1) Toolbar of the tool window
The toolbar in the Count and Measure Results tool window changes its appearance each time, depending on which results view is currently active. Which buttons are available on the toolbar is described in the corresponding help text for the results view concerned.
Results views
(2)
|

|
Object Measurements
|
Use the Object Measurements results view to display the measurement results for all of the objects that were detected. In this sheet, the individual results for all of the selected measurement parameters are shown for all objects. You can display statistics.
|
(3)
|

|
Object Filter
|
Define an object filter for the results. Measurement values that don't fall within this filter range, won't be shown. Measurement values that don't fall within this filter range are not included in any of the results views and are not taken into account for the statistics.
The Object Filter results view can also be used for the visual display (histogram) of the results of a measurement parameter.
|
(4)
|

|
Class Measurements
|
Click the Class Measurements results view to have the results for all of the object classes and the statistical parameters for the class measurements displayed in a results sheet.
If you used ROIs in the analysis, you can display the class results for each ROI here.
|
(5)
|

|
Class Histogram
|
Click on the Class Histogram results view to have the results for the object classes displayed as a histogram. In the histogram, class results are displayed graphically.
|
(6)
|

|
ROI Measurements
|
Click the ROI Measurements results view to have the measurement results for the ROIs displayed in a results sheet. The results for all of the defined ROIs and the statistics for the ROI measurements are shown in this sheet.
|
(7)
|

|
ROI Histogram
|
Click the ROI Histogram results view to have the measurement results for the ROIs displayed as a histogram. In the histogram, results of the ROI measurements will be displayed graphically.
|
See also
Overview - Automatic image analysis
Carrying out an automatic image analysis
Tool Window - Count and Measure
1956 24112014
|