Use the ROI Histogram results view in the Count and Measure Results tool window to have the results for the ROIs shown in a histogram. Depending on the grouping dimension, the results will be shown either as a column or as a line diagram.
Example: You can have the number of the detected objects per ROI displayed. The grouping dimension then is ROI.
Use the View > Tool Windows > Count and Measure Results command to have the tool window displayed. Should the ROI Histogram results view not yet be active, click the ROI Histogram tab to activate it.
Structure of the tool window
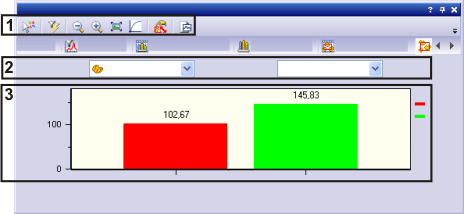
The tool window is made up of several groups. Click on one of the areas in the tool window shown schematically above to jump to the corresponding help topic.
(1) Toolbar in the results view
See also
Carrying out an automatic image analysis on ROIs
Tool Window - Count and Measure Results
(1) Toolbar in the results view




In the ROI Histogram results view, you can find a toolbar with the following buttons.
|
Click this button to select an individual object, or also several objects. |
|
|
Click this button to switch the current object filter on or off. |
|
|
Use these buttons to change the way the histogram is displayed. Click here to learn more. |
|
|
Click this button to select the measurement parameters for the ROIs that are to be output in the histogram. |
|
|
Click the Export to Chart button, in order to export the histogram from the tool window into an individual document type. You can find the diagram document with the exported histogram, in the document group. |
|
(2) Parameter selection
Selecting measurement parameters for ROIs
In the Measurement picklist select the measurement parameters for ROIs, e.g., Object Count (per ROI), that are to be displayed in the histogram. You will be offered all of the measurement parameters for ROIs that have been selected in the Select ROI Measurements dialog box with exception of the image names or the indications. There can always be only one measurement parameter selected.
Selecting the grouping dimension
In the histogram, the frequency distribution of the measurement values is graphically displayed. In the histogram, the measurement values are shown according to a certain dimension. In this way you can have the mean area of the objects in a ROI displayed. To do this select the Mean (Area) measurement parameter, and the ROI grouping dimension.
In the Grouped by picklist, select the dimension in which the results are to be displayed. With a time stack this could be e.g., the Time grouping dimension.
The histogram will be automatically updated, as soon as a measurement parameter in the Measurement or Grouped by picklist is changed.
For example:
You select the Object Count entry in the Measurement picklist and the ROI entry in the Grouped by picklist. In this case, a separate column will be displayed in the histogram for every defined ROI. The height of the column corresponds to the number of objects that were detected in the ROI.
In this example, three ROIs have been defined on the image. In the red ROI the most objects can be found. The class that an object belongs to doesn't play a role in this representation.

Note: Class results are always shown in the Class Measurements results view. When more than one ROI is defined, the class results for each individual ROI are displayed there.
If you want to see the area distribution of the objects per ROI, you have to switch to the Class Histogram results view.
(3) Histogram display
The histogram portrays the frequency distribution of a measurement parameter for ROIs, in relation to the grouping dimension. The measurement parameter values for the ROI are plotted along the Y-axis and the respective grouping dimension, e.g., ROI or Time is plotted along the X-axis.
Depending on the context, the results will be shown either as a column or as a line diagram. You will be issued with a line diagram, for example, when you select the entry Time as the grouping dimension. The colors the columns or lines are shown in, correspond to the colors assigned to the ROIs. To the right of the histogram, a caption, showing the color assignments for all of the ROIs, will be shown.
Changing the histogram display
Use these buttons to change the way the histogram is displayed. Click here to learn more.
Error message
In some cases you will receive an error message, that will appear instead of the histogram. There can be various causes for that.
•No object analysis has been carried out. A prerequisite for the histogram display, is that measurement results are on hand.
•No ROIs have been defined nor has a detection on ROIs taken place.
•The dimension selected isn't available for the image. Only a time stack contains numerous separate images, that have been acquired at different times. Therefore, you can only use the Time grouping dimension for time stacks.
00509 05122014