|
|
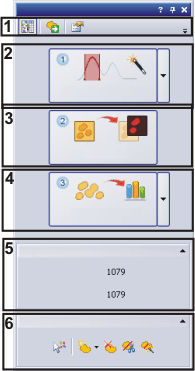
Use the Count and Measure tool window to perform an automatic object analysis. Should this tool window not be on display, use the View > Tool Windows > Count and Measure command to display it. Prerequisite: The automatic object analysis functions are only available when the Detection software solution has been purchased and is active. Structure of the tool windowThe tool window is made up of several groups. Click on one of the areas in the tool window shown schematically above to jump to the corresponding help topic. (1) Toolbar of the tool window (5) Object Count See also Overview - Automatic image analysis Carrying out an automatic image analysis Tool Window - Count and Measure Results (1) Toolbar of the tool windowThe Count and Measure tool window's toolbar makes the following buttons available to you:
(2) Setting threshold valuesClick the Automatic Threshold... button to define the foreground and background of the image. All of the objects that are to be analyzed have to belong to the image's foreground. You can find an overview of the different threshold value methods here. Context menu commandsOpen the Automatic Threshold... button's context menu by clicking the small arrow next to the button. There you can find numerous commands for setting threshold values. Use the Automatic Threshold... command, if you want to have the threshold values calculated automatically. Use the Manual Threshold... command, if you want define the threshold values yourself, interactively. By default, the threshold values for true-color images will be defined in the RGB color space. Use the Manual HSV Threshold... command, if you want to define the threshold values for a true-color image interactively in the HSV color space. Use the Segmentation Options... command to open the Count and Measure > Options > Segmentation dialog box. You can find more information on this dialog box here. The button's appearanceDepending on the image type and the currently active segmentation method, the Thresholds button will have a somewhat different appearance, and will open different dialog boxes for setting thresholds. Note: Which of the 4 possible Threshold... buttons is selected in the Count and Measure tool window always depends on the analysis that was last carried out. For example, when the last image that was analyzed was a gray-value image, and you now want to analyze a true-color image, the button will therefore be displayed in gray and will not react. In this case, in the Thresholds... button's context menu, select the segmentation method that corresponds to the image type. (3) Performing a segmentationWith one click on the Segment button, the second step in an analysis, the segmentation, will be performed, and shown in the image window. When the button is hidden, this step will be automatically carried out, when you click the Count and Measure button. The Segment button is hidden by default. To show or hide the button, click the Count and Measure Options button, located in the Count and Measure tool window. In the Options dialog box, select the Count and Measure > Segmentation entry. Select the Show 'Segment' button check box, located in the Options group, if you want to make the Segment button appear in the Count and Measure tool window. (4) Counting and measuringClick the Count and Measure button to carry out an object analysis and to output the results. The Count and Measure button's appearance depends on whether you carry out the analysis on a specific image segment, (ROI), or on the complete image. Open the Count and Measure button's context menu by clicking the small arrow next to the button. In it, the following commands are available: Count and MeasureSelect the Count and Measure command to have an automatic analysis performed on the complete image. The button in the Count and Measure tool window will now be labeled, Count and Measure. Click this button to calculate and output the results with the current threshold value settings. Count and Measure on ROISelect the Count and Measure on ROI command to limit the automatic analysis to one or several segments of the image. The button in the Count and Measure tool window will now be labeled Count and Measure on ROI. Click this button to output the results with the current threshold value settings, and for the currently defined ROIs (Region of Interest). New ROISelect the New ROI command to define image segments for the automatic analysis on a ROI. A context menu that offers you 3 tools for the definition of ROIs, will open. You can define an ROI as a rectangle, circle or polygon. It is also possible to define several ROIs with different tools, on an image. Note: Defining a ROI doesn't yet mean that this ROI will also be used for the next analysis. To use ROIs for the analysis, select the Count and Measure on ROI command from the context menu. Count and Measure OptionsSelect the Detection Options... command to open the Options > Count and Measure > Detection dialog box. Here you can specify whether you want holes in the particles to be filled, among other things. You can find more information on this dialog box here. Classification OptionsUse the Classification Options... command to open the Count and Measure > Options > Classification dialog box. Use this dialog box to define a new classification scheme. You can find more information on this dialog box here. Adjust Current ClassificationUse the Adjust Current Classification..., command to edit the current classification scheme. You can find more information on this dialog box here. (5) Object CountIn the Object Count group, the total number of objects that were counted by the last image analysis on the current image is shown. In the In filter ranges field, the number of measured objects that lie within the defined filter range, will be shown. Should no filter range have been defined, this value will be the same as the total number of objects that were measured. You can find more information on how to define filter ranges for objects here. (6) Editing the objects
The Edit Objects group, offers several ways in which you can modify the results of an automatic object analysis, if necessary. With the buttons' commands, objects can be separated from each other, deleted, or also added again.
See also 1955 03123014 |