|
|
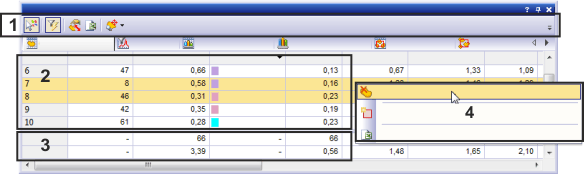
Use the Object Measurements results view, in the Count and Measure Results tool window to have the measurement results for the objects shown to you as a sheet. In this sheet, the individual results for all of the selected measurement parameters and statistics are shown for all objects. Use the View > Tool Windows > Count and Measure Results command to have the tool window displayed. Should the Object Measurements results view not yet be active, click the Object Measurements tab to activate it. Structure of the tool windowThe tool window is made up of several groups. Click on one of the areas in the tool window shown schematically above to jump to the corresponding help topic. (1) Toolbar in the results view (2) Results for object measurements (3) Statistics (4) Context menus See also Carrying out an automatic image analysis Tool Window - Count and Measure Results Options - Count and Measure - Measurements Options - Count and Measure - Results (1) Toolbar in the results view
The following table lists the buttons that are relevant to the object measurements.
(2) Results for object measurementsThe results of your analysis will be shown in the results sheet. At the top of the sheet, the results for measurement parameters you've selected are shown for all detected objects. Which measurement parameters are displayed?When an object analysis is carried out, all available measurement parameters will be automatically computed. In the results sheet, only some of the available measurement parameters are shown. Select the measurement parameters by clicking the Select Object Measurements button in the tool window's toolbar. You can change the selection of measurement parameters at any time without having to repeat the image analysis. Object - sheet linkThe results sheet and the image window are linked to one another. When you select a row with a measurement value in the results sheet, the corresponding object will be selected in the image window. Select an object in the image window, the corresponding row will be selected in the results sheet. If you want to select several objects in the image window, or several rows in the results sheet, keep the [Ctrl] key pressed while you're doing so. Structure of the results sheetIn the column's header, you'll see the name of the measurement parameter. In the cells below it you'll find the values for the individual measurements of the respective parameter. The number of individual measurements that are shown depends on a variety of factors, such as the image type, the number of phases and objects, and the settings in the options. You can find more information on the options here. Example: You have counted objects on 10 images. In the Options > Count and Measure > Results tool window, you can specify whether to display the measurement results from all images or just the current image. Select the Only show results of the active image check box if you only want to list the objects that were detected on the active image. Within a column, there is always only one unit for all of the measurement values. This unit depends on the calibration of the active image. When you accumulate data from several images, the smallest unit from all of the images will automatically be used. You can consolidate the measurement values for all of the images that have been calibrated in the same basic unit, in meters for example. It is not possible to accumulate the measurement values of images that have been calibrated in different basic units, length and pixels for example. The order of the columns can't be changed in the results view. It is preset by the succession of the measurement parameter in the Select Object Measurements dialog box, and can only be changed there. Sorting the results sheet by a measurement parameterYou can sort the results sheet according to a particular measurement parameter. To do this, double click on the header of the column that contains the required measurement parameter. This column's measurement values will then be sorted in ascending or descending order. Double click the header of the column again to sort the measurement values in the reverse order. An arrow in the header will show you the direction in which they are sorted. (3) StatisticsStatistical parameters can be calculated for every measurement parameter. When, for example, you have chosen the Mean statistical parameter, the mean value of all of the individual measurements will be shown for each measurement parameter. The mean value is then, for example, the mean area of all of the objects, or the mean circularity of all of the objects, etc. The statistical parameter's unit is the same as the measurement parameter's. That is to say, if the area ratio has been given in mm² , the mean value for this measurement parameter will also be a value in mm². For some measurement parameters, such as, for example, indices, no statistical parameters can be calculated. In this case, a dash will be shown. The values for the statistical parameters are shown in the column, below the respective parameters. The statistical parameter's name is shown on the left, at the beginning of the row. The order of the statistical parameters in the results sheets can't be changed. You can completely switch of the display of the statistical parameters, or also select only certain parameters. Open the Options > Count and Measure Results dialog box to make these settings. (4) Context menusContext menu of the sheetRight click on the sheet shown in the Object Measurements results view. You can find the following commands in the context menu:
Context menu of the table's columnsRight click on the column header. You can find the following commands in the context menu: Prerequisite: The context menu is only available when the column shows measurement results with the data type Double.
00504 24112014 |