Use the Manual Threshold dialog box to manually define the threshold values in a gray-value image.
Setting threshold values is necessary to define objects in an image for an object analysis. Phases will be defined in the image by appropriate threshold values. You can find more information on threshold values and phases here.
Opening the dialog box
You open this dialog box, via the Count and Measure tool window. Load a gray-value image. Select the Manual Threshold... entry, in the Threshold button's context menu. You open this menu by clicking the small arrow next to the button. If this entry is already selected, simply click the Manual Threshold... button.
The dialog box's structure
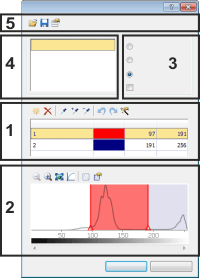
The dialog box is made up of several groups. Click on one of the areas in the dialog box shown above to jump to the corresponding help topic.
(1) Defining phases and threshold values
(4) Channel display
(5) Loading, saving, and managing threshold values
See also
Carrying out an automatic image analysis
Tool Window - Count and Measure
(1) Defining phases and threshold values
Defining phases
Use the Phase thresholds for channel '...' group to define phases and to determine threshold values manually.
Adding phases
Click the Add Phase  button to add a phase for which you want to determine the threshold values.
Double click the Phase Name field to enter a name for the phase.
Double click the field in the Color column to open the color palette and to select a color for the corresponding phase.
The phase will be displayed in the color you have assigned it, in the image window and in the histogram. In the [ Min. field, the threshold value range's lower value is specified. In the Max. [ field, the higher value is specified. The higher value itself no longer belongs to the threshold value range. The values shown will have been adopted from the last threshold value setting that was carried out.
Deleting phases
Click the Remove Phase  button to delete a phase. At least one phase will always be defined. It's only possible to remove a phase when two phases have been defined.


 Defining threshold values interactively on the image
Select a phase for which you want to set threshold values, by marking it in the Phase thresholds for channel '...' group.
Note: If you would like to set threshold values for several phases in a gray-value image, you will have to begin by setting the threshold value for the darkest phase. Then set the threshold value for the next brightest phase, and so on.
Click the New Threshold button to set an initial value for the selected phase's threshold value range. As soon as you move your mouse pointer onto the image it will change its shape to that of a pipette.
Click on one pixel or on the image area whose intensity value is to be utilized as the initial value for the threshold range. All of the pixels that have the same intensity value will be colored in the image, and displayed in the histogram. The threshold value range initially contains only this one intensity value. As a rule, you will still need to expand this threshold value range.
Once the initial value has been set, your mouse pointer will automatically change into a pipette with plus icon You can now immediately add further pixels to the threshold value range. Continue clicking relevant pixels or threshold value ranges, until all of the required structures in the image are a part of the phase.
Click on the Add Threshold button to select additional pixels that are to belong to the threshold value range. While keeping your left mouse button depressed, select further image segments. The image segments will be colored and displayed in the histogram. The current threshold value range will continue to be expanded until it contains the intensity values of all of the selected pixels. To gain a better visual control during the threshold value setting, you can enlarge the image. Even when the Manual Threshold dialog box has been opened, you can still use your software's zoom functions as usual. Move your mouse pointer onto the appropriate position in the image, then use the mouse wheel to zoom into or out of the image.
Click the Shrink Threshold button to select pixels that aren't to belong to the threshold value range. The threshold value range will continue to be reduced until it no longer contains the pixels you have selected.
For example: The current threshold value range comprises the values 10-50. When you now select a pixel whose intensity value is 60, the current threshold value range will be extended to 10-60. When you now select a further pixel whose intensity value is 5, the current threshold value range will be extended to 5-60. All of the pixels that are already within the current threshold value range, are colorized in the image, all of the others lie outside the current threshold value range. When you activate the Shrink Threshold function, then click a colorized pixel, for example with an intensity value of 55, the current threshold value range will be reduced to 5-55.
It is also possible to enter threshold values directly. To do this, double click the [ Min. or the Max. ] field, then enter the required value. Click the Undo Pipet  button to undo the last selections step by step.
Click the Redo Pipet  button to restore the last selections that were undone, step by step.
Calculating threshold values automatically
Click the Compute phase thresholds automatically  button to have the threshold values calculated automatically to begin with. You can then process them manually if required. The Automatic Threshold Computation dialog box opens. A description of this dialog box can be found here.
(2) Histogram display
The histogram shows the current image's intensity distribution. You can find more information on the histogram display here.
Defining threshold values interactively on the histogram
The threshold value range can also be defined directly in the histogram display. To do this, move your mouse on the histogram. When you move your pointer over the current threshold value range, it will change its appearance.
To set the threshold value range, move your pointer to one of the two limits of the current threshold value range. Your pointer will change into a slide control.
To drag out the required threshold value range, keep your left mouse button depressed. The range you select will be simultaneously colorized in the image, providing you with a constant visual control.
To shift the complete threshold value range within the histogram, move your pointer onto the current threshold value range. When you do this, your pointer will change into a hand. Then keep your left mouse button depressed to move the whole of the threshold value range to the left or right. The intensity values themselves will change, but not the number of included values.
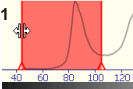
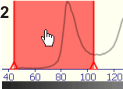
Illustration (1) shows the mouse pointer as a slide control. With your left mouse button depressed, you can drag out the threshold value range you want.
Illustration (2) shows the mouse pointer as a hand. With your left mouse button depressed you can move the whole of the threshold value range to the left or right.
(3) Setting preview options
Use the Preview of phases group to display the phases in color in the image when setting the thresholds. By using the Preview you will have a direct visual control over which image areas belong to a phase and which don't. The phases are only displayed in color as long as the dialog box for setting thresholds is open.
Select the None option to have the preview switched off. None of the phases that have been defined will be displayed in the image in color.
Select the Current option to have the currently selected phase shown in its assigned color, in the image. You select a phase, by clicking it in the Phase thresholds for channel '...' group.
Select the All option to have all of the defined phases shown in the image, in their assigned colors.
Select the Transparent option to make it possible to recognize the image structures despite the phases being displayed in color.
Even when the dialog box for setting threshold values is open, you can still use your software's zoom functions as usual. Move your mouse pointer onto the appropriate position in the image, then use the mouse wheel to zoom into or out of the image.
The default setting for the Preview of phases group, is the All option. Every time you reopen the dialog box, the All option will therefore be initially set.
(4) Channel display
In the Channel group, the active image's channels are shown.
As a rule, your images only contain one channel. The standard name for this channel is Gray.
(5) Loading, saving, and managing threshold values
Use these buttons to load, save or change the threshold value settings. You can save the following settings to a parameter set: The phase's name, the number of phases and the colors assigned to them.
When automatically setting threshold values, the intensity ranges belonging to the individual phases are recalculated for each image.
You will find more information on working with parameter sets here.
5612 24112014