In many dialog boxes, you can find that a histogram chart is displayed.
Histogram in the dialog boxes for setting threshold values
In the dialog boxes for setting the threshold values, the intensity histogram of the active image is shown. The histogram shows the distribution of the intensity values in the image.
Histogram in the results views of the automatic image analysis
In the Count and Measure Results tool window's results views, the distribution of a specific measurement parameter is shown. For example, the size distribution is shown for the detected objects.
See also
Tool Window - Count and Measure Results
Changing the display of the histogram
Use these buttons to change the way the histogram is displayed.

Zoom buttons

 Use the zoom buttons in this toolbar to spread or compress the values along the histogram's X-axis.
 Click this button to alter the histogram's scaling so that all of the available values are displayed.
Logarithmic scaling / Linear scaling
 Click the Logarithmic Scale button to change the scaling of the Y-axis from a linear to a logarithmic representation.
With a logarithmic representation, very small Y-values will be shown on a relatively large scale while greater Y-values will be relatively reduced in scale.
 By clicking the Linear Scale button now, you will return to a linear scaling of the Y-axis.
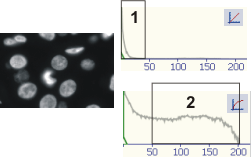
The illustration shows an example of a case where a logarithmic presentation is useful. The image on the left shows bright image structures mapped against a largely black background. In this case, by far the most pixels belong to the image's background, and this creates a high, narrow peak in the histogram (1). The pixels that are of real interest, are, in contrast, spread over a wide range of intensity values. The actual image information then only creates a very wide and flat peak that can not be seen in the linear histogram (top). When the logarithmic representation is used, the peak (2) containing the actual image information also becomes visible.
Image segment for histogram calculation
Prerequisite: These buttons are only available in the dialog boxes for settings the thresholds.
You can define a specific segment in the image for which you want to calculate the histogram. By doing this, you can improve the quality of automatically calculated threshold values. The threshold values are then calculated using to the histogram of only this segment. But please note that the threshold values are valid for the complete image.
 By clicking the Define Region button, you can define a rectangular area within the image, for the calculation of the histogram. As soon as you've activated this button, your mouse pointer will jump into the active image. You can then, while keeping your left mouse button depressed, drag out an area in the image for which the histogram is to be calculated.
 By clicking the Use Region button, you can switch between the histogram calculation according to the image segment, and according to the complete image. When this button is active, the histogram is calculated for the rectangular image segment. You will recognize this status by the fact that the button is framed in black.
This button is only available when you have defined a rectangular area on the image using the Define Region button.
00349 21112014