|
Use the Line Profile tool window to measure the intensity profile along a line on an image. You can expand the line profile and take the image area surrounding the line into account in the computation. This allows you to compute the average intensity profile across this area. Should this tool window not be visible, use the View > Tool Windows > Line Profile command to show it.
Structure of the tool window
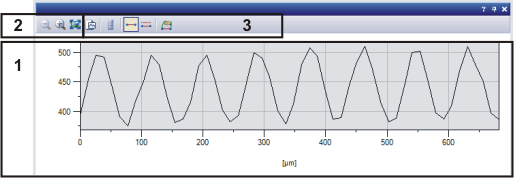
The tool window is made up of several parts. Click on one of the areas in the tool window shown to jump to the corresponding help topic.
(1) Chart showing the line profile
(2) Display of the line profile
(3) Toolbar of the tool window
See also
Overview - Line Profile
Line Profile Settings
(1) Chart showing the line profile
Your software measures the intensity in the image along a line, and shows the measured intensity in a chart. You can find this chart in the Line Profile tool window, usually at the bottom of your user interface. The distance along which the intensity profile will be measured is plotted along the X-axis of the chart. The intensity values are plotted along the Y-axis.
back to top
(2) Display of the line profile
Use the first buttons on the tool window's toolbar to change the appearance of the line profile.
  
|
Zoom Out, Zoom In
|
Use the zoom buttons in the toolbar to spread or compress the line profile. Please note that the X and Y values will be simultaneously changed.
|
|
Zoom to Fit
|
Click this button to alter the scaling in such a way that all of the values in the line profile are displayed in the tool window. Your software will then calculate the minimum and maximum intensity values in the image, and will automatically display the whole of the intensity range that is covered by the image.
|
Changing the display of the chart using the mouse
Rotate the mouse wheel to change the zoom factor.
If the chart is maximized in the tool window, you can move it using the mouse.
You can move the whole chart within the tool window. You can drag the chart within the frame.
Move the chart in the X or Y-direction. To do so, move your mouse pointer below or beside the chart. Your mouse pointer then takes on the shape of a double arrowhead  . Drag the chart to a different position. . Drag the chart to a different position.
Alternatively, you can zoom the chart in the X or the Y-direction. To do so, move your mouse pointer below or beside the chart. Your mouse pointer then takes on the shape of a double arrowhead . Move the mouse wheel forwards or backwards to zoom in the direction you want.
back to top
(3) Toolbar of the tool window
The following table lists the buttons which are available by default on the toolbar.
 Export to Chart Export to Chart
Click the Export to Chart button to export the line profile to a chart document. In contrast to the line profile that is displayed in the Line Profile tool window, you can save a chart, edit it and also measure it.
The chart with the line profile will be displayed in the document group. The chart's name is Line Profile + <serial No.>.
To save a chart, select the File > Save As... command. The OCT file format will be automatically chosen. This format is exclusive and can therefore, only be opened with your software.
You can measure a chart. To do so, use the Horizontal Line... or Multiple Horizontal Lines... command in the Measure menu.
You can change the appearance of the chart by choosing a different background color, for example. You can find more information on this topic here.
Note: No link exists between the line profile in the Line Profile tool window and the chart. When changes occur in the line profile in the tool window, the chart won't be automatically updated, but will have to be newly created each time.
back to "Toolbar of the tool window"
 Export to Excel Export to Excel
Click the Export to Excel button to export the line profile's intensity values to a MS-Excel sheet. You can use this export option when you want to further evaluate the values from the line profile, for example.
Note: The line profile in the Line Profile tool window and the exported data aren't linked to each other. When the line profile in the tool window changes, a new sheet has to be created.
back to "Toolbar of the tool window"
 Toggle orthogonal line profile mode Toggle orthogonal line profile mode
Click the Toggle orthogonal line profile mode button to align the line profile exclusively in a horizontal or vertical position. When the mode has been switched on, this button appears clicked. You can recognize this status by the button's colored background.
Click on the one of the reference points at either end of the line profile. Drag the reference point in the direction you want. The line profile can be rotated by 90° and automatically snaps to a vertical or horizontal position.
If you press the [CTRL] key while rotating, the line profile rotates in 90° steps around its center.
back to "The tool window's toolbar"
 Measure Distance Measure Distance
Click the Measure Distance button to measure a distance on the line profile. You can either measure on the line profile in the active image or on the chart in the Line Profile tool window. To do so, click on the starting and endpoints of the segment to be measured. The measured distance and the result of the measurement are displayed on the line profile in the active image and also in the chart.
back to "The tool window's toolbar"
 Show position feedback Show position feedback
Prerequisite: The Show position feedback button is only active when you have displayed a line profile with the Toggle Line Profile button.
Use the Show position feedback button to mark a position in the line profile on the active image and to simultaneously display this position in the Line Profile tool window. This enables you to see the intensity values of a particular position on the sample in the Line Profile tool window.
Click the Show position feedback button. A reference point is shown in the middle of the line profile. You can drag this reference point to a different position. The position of the reference point is shown in the Line Profile tool window with a vertical line. This enables you to view the intensity value of a position on the sample precisely.
Alternatively, you can click a position in the Line Profile tool window. A vertical line is inserted at this position. You can drag this vertical line to a different position. This position is indicated by a reference point in the active image's line profile.
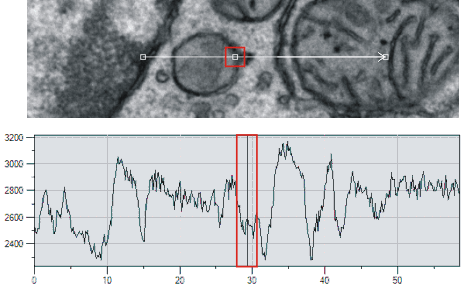
Illustration (1) shows the line profile with a reference point.
Illustration (2) shows the Line Profile tool window. The reference point's intensity is indicated by a vertical line in the chart.
Note: You can expand the line in the image into a rectangular area. This displays in the chart the average intensity of the pixels vertical to the line in this defined area. As long as the Show position feedback function is active however, you can't change the rectangular area around the line. Deactivate the Show position feedback function if you want to change the rectangular area. If you then activate the Show position feedback function again, the previously set position for the reference point is retained.
back to "Toolbar of the tool window"
 Toggle Line Profile Toggle Line Profile
Your software measures the intensity in the image along a line, and shows the measured intensity in a chart. Click the Toggle Line Profile button to show or hide the line profile. When the line profile is on display, this button appears clicked. You can recognize this status by the button's colored background.
The line along which the intensity is measured is now displayed in the image window. At the same time, you see the current line profile in the Line Profile tool window.
You can position the line wherever you want to in the image. Just move the whole line while keeping the left mouse button depressed. It is also possible to shift the starting point or the end point of the line with your left mouse button pressed. You can rotate the line around its center by holding the [Shift] key while dragging either end of the line. If you drag either end of the line while holding the [Ctrl] key, you can rotate the line around its center in 15° increments.
You can expand the line profile over the total width of the image very quickly. Hold down the [Home] key on your keyboard while dragging the line profile.
Drag the line's middle control point down to widen the line profile into a rectangle. The line profile chart now displays the mean intensity value of all of the pixels within the defined area that are at right angles to the line.
back to "Toolbar of the tool window"
 Toggle Reference Lines Toggle Reference Lines
Click the Toggle Reference Lines button to show or hide a reference line in the Line Profile tool window. When the reference line is on display, this button appears clicked. You can recognize this status by the button's colored background.
The position of the current line will be used as a reference line. Therefore, always define the position of the reference line before you click the Toggle Reference Lines button to the active status. Move the line profile subsequently, as usual, to another position. The reference line will then be visible as a dashed line. The position of the reference line remains fixed.
Two curves will then be shown in the tool window. The continuous line is the normal line profile. The dashed line is the difference between the reference line's intensities and those of the normal line profile.
Click the Toggle Reference Lines button to hide the reference line. When you click the button again, the current line will be used as the reference line.
The reference line will be automatically hidden when you change the line profile's length.
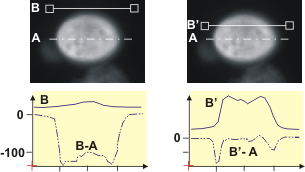
The illustration shows the same sample twice. A is the reference line, that is at the same position in both cases. The line profile B can be measured in various positions.
In the illustration on the left, the line profile B lies on the dark background. For this reason, it runs relatively flat. The difference B-A between the reference line A and the line profile B is greatest at the edge of the cell, because it is there that the intensities differ most from those of the reference line.
In the illustration on the right, the line profile B' goes into the cell. The line profile in the tool window shows the cell's intensity profile. The difference B'-A is only different on the edges of the cell. Only there the difference line diverges from the value 0.
back to "Toolbar of the tool window"
 Line Profile Settings Line Profile Settings
Click this button to open the Line Profile Settings dialog box. You can make a variety of settings for the line profile here. A description of this dialog box can be found here.
back to "Toolbar of the tool window"
back to top
5542 04032015
|