Use this dialog box to define your personal default settings for the appearance of charts in your software. A chart can, e.g., be exported from the Measurement tool window.
Use the Tools > Options... command to open this dialog box. Select the Chart > Display entry in the tree view.
Description of dialog box
Setting the background color
You can assign two different background colors to a chart.
Click the Inner background color field to open a color table. You can select one of 16 possible colors in the color table.
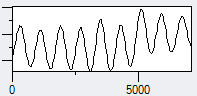
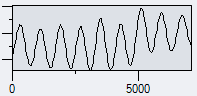
The illustration shows a chart with different background colors for the actual chart.
Click the Outer background color field to open a palette with 16 different colors. Select a color.
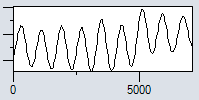
The illustration shows a chart with different background colors for the chart's document window.
Showing a grid
Select the Show grid check box to lay a line grid over the chart. The lattice spacing is preset and cannot be changed.
Clear the Show grid check box to fade out the grid.
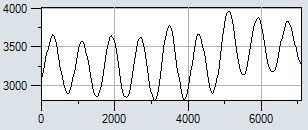
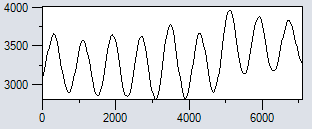
The illustration shows a chart with a grid over it and without a grid over it.
Showing a legend
Select the Show legend check box to have a caption with all of the parameters that will be shown in the chart, displayed to the right of the chart.
Clear the Show legend check box if you do not want to have the caption displayed.
Getting the settings from the active chart
Click the Get From Active Chart button, if the specific settings of a chart that has just been loaded, are to be adopted for the personal settings.
Note: When you change the default settings in this manner, only new charts will be customized.
1770 14032014