Use the Tools > Options... command to open this dialog box. Select the Images > Tool Windows entry in the tree view.
See also
Adjust Display
In this group, the setting has an effect on the Adjust Display tool window.
Showing / hiding the mapping function
The mapping function determines how an image processing operation will effect an image. You will find more information on the mapping function here.
Here, you specify whether, and how, the mapping function is to be shown in the Adjust Display tool window.
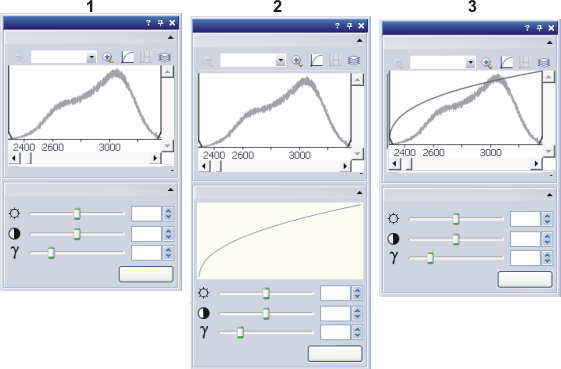
The illustration shows you schematically, what the Adjust Display tool window looks like, depending on whether you have selected the option (1), (2) or (3).
(1) Display enhancement curve > Hide: The mapping function will not be shown in the tool window.
(2) Display enhancement curve > Show separately: In the tool window, a diagram with the mapping functions will additionally be shown. The mapping function will be shown in the Display Enhancement group. You can find more information on this topic here.
(3) Display enhancement curve > Show in histogram: The mapping function will be shown within the histogram.
Please note that in this case, the diagram's Y-axes have a different significance for the mapping function and the histogram.
Scaling of the Y-axes in the histogram
The Zoom to fit within Y limits check box influences how the histogram is displayed in the Adjust Display tool window. This is especially relevant for the Fixed Scaling option.
In the histogram, two lines are shown. In the image window, only those intensity values will be shown, that lie between the lines. All intensity values that are smaller or greater, will be automatically shown in black or white.
Select the Zoom to fit within Y limits check box to have the Y-scaling of the histogram automatically adjusted to the current positions of the lines. The Y-scaling will then be changed in such a way, that the intensity range between the lines will be optimally displayed in the histogram.
Clear the check box, and the Y-scaling will remain constant when the green lines change.
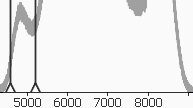
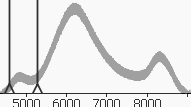
The illustration shows the same histogram twice. On the left, the Zoom to fit within Y limits check box has been selected, on the right, it is has not been selected.
Select the Histogram > Zoomable in Y direction check box to have an additional slide control brought up. Use this slide control to change the Y scaling of the histogram.
3302 22032013