The mapping function f determines how an image processing operation will effect an image.
It is assumed that Io are the source image's intensity values. The resulting image's intensity values will be calculated using the following equation.
I = f(Io)
An example would be the following mapping function: I = Io + Offset. In this way, a fixed value "Offset" will be added to every intensity value of the source image. The image will become brighter.
Diagram with mapping function
The mapping function can be shown in a diagram. The image's intensity values are plotted along both of the diagram's axes. The mapping function tells you at which intensity value of the resulting image an intensity value of the source image is displayed.
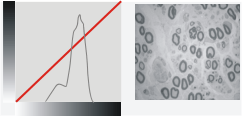
On the left is the histogram corresponding to the image on the right. The mapping function is superimposed on the histogram in red. The mapping function doesn't change the image's intensity values The source image's intensity values will be mapped one to one to the intensity values of the resulting image.
What effect does it have on the mapping function when you, for instance, change the brightness and contrast of an image?
Changing brightness
Decreasing the brightness means moving the mapping curve downwards in Y-direction. In this way, you subtract a constant that you set via the intensity slider from the mapping function. The image will become darker.
Increasing the brightness means moving the mapping curve upwards in Y-direction. In this way you add a constant that you set via the intensity regulator, to the mapping function. The image will become brighter.
Changing contrast
Changing the contrast means rotating the mapping curve around the center point of the chart. The mapping function will then become either steeper or flatter.
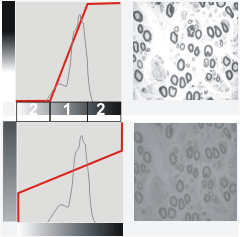
On the left is the histogram with the mapping function shown in red.
In the first example, the contrast is being increased. The intensity values in range (1) are being spread across the whole intensity range. The intensity values in range (2) are displayed in white or black.
In the second example, the contrast is being decreased. The gray values in the source image are mapped to a smaller gray-value range.
If the mapping function becomes steeper, a small intensity range in the source image will be mapped to a larger intensity range in the resulting image. In this way, the source image's intensity values will be spread. The result will be a higher contrast in the resulting image.
If the mapping function becomes flatter, a large intensity range in the source image will be mapped to a smaller intensity range in the resulting image. Small differences in intensity in the source image will be lost in this process. The result will be a lower contrast in the resulting image.
00046