You can find the Histogram group in the Adjust Display tool window. It contains a graphical display of the histogram and a functions group for adjusting the appearance of an image in the image window.
Description of the group
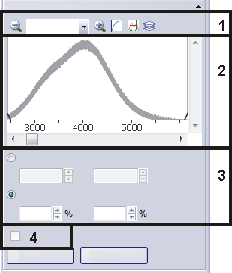
Click on one of the areas in the tool window shown above to jump to the corresponding help topic.
(2) Diagram in the tool window
(3) Auto Contrast / Fixed Scaling
(1) The tool window's toolbar
Use the toolbar in the Histogram group to change the appearance of the histogram in the tool window.

 Scaling of the X-axis
Use the zoom buttons in this toolbar to spread or compress the values along the histogram's X-axis. The intensity range is plotted along the Y-axis.
Use the slide controls below the histogram to have the intensity range you are interested in, displayed.

You can change the scaling of the X-axis, to have the histogram displayed optimally. There are some predefined ranges for the X-axis. Select the range you want from the list.
If the active image is an 8-bit image, select the 8 bit entry. Now, only the intensity values 0-255 are displayed on the X-axis. An 8-bit image only contains these intensity values.
If the active image is a 16-bit image, select the 16 bit entry. Now, the intensity values 0-65536 are displayed on the X-axis.
Especially with a 16-bit image, as a rule, not all of the intensity values that are possible in this image format, appear in the image. Select the Min./Max. entry to have the histogram scaled in such a way as to let you see only the intensity values that can really occur in the active image. The scaling of the X-axis now runs from the image's lowest, to its highest, intensity values.
The current image's smallest and greatest intensity values will be shown beneath the diagram.
As soon as you have changed the X-scaling by using the zoom buttons, the displayed X-range is changed. In the pick list, the Zoom entry will be selected automatically.

 Scaling of the Y-axis
The scaling of the Y-axis will automatically be adjusted in such a way that all values of the currently displayed histogram range are shown. On the Y-axis the number of pixels with a specific intensity value will be plotted.
However, it is possible to choose between a logarithmic and a linear display.
Click the Logarithmic Scale button to change the scaling of the Y-axis from a linear to a logarithmic representation. On the Y-axis the number of pixels with a specific intensity will be plotted.
With a logarithmic representation, very small Y-values will be shown on a relatively large scale while Y-intensity values will be relatively reduced in scale.
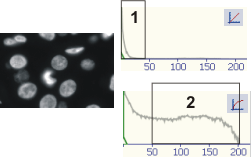
The illustration shows an example of a case where a logarithmic presentation is useful. The image on the left shows bright image structures mapped against a largely black background. In this case, by far the most pixels belong to the image's background, and this creates a high, narrow peak in the histogram (1). The pixels that are of real interest, are, in contrast, spread over a wide range of intensity values. The actual image information then only creates a very wide and flat peak that can hardly be seen in the linear histogram (top). When the logarithmic representation is used, the peak (2) containing the actual image information also becomes visible.
By clicking the Linear Scale button now, you will return to a linear scaling of the Y-axis.
With the Link Limits and Unlink Limits buttons, you can specify which intensity range is displayed in the image window yourself. In the histogram, this intensity range is identified by two vertical lines.
 Click the Link Limits button to keep the actual intensity range fixed when one of the two limits of the intensity range is moved.
 Click the Unlink Limits button to move each limit of the displayed intensity range separately.
Example: In the image window the intensity range 1000-1500 is displayed. Choose the Fixed Scaling option, and enter the limits of the intensity range you want in the Left (=1000) and Right (=1500) fields.
If both limits are linked, the intensity range on display keeps 500. That is to say, setting the upper limit to 2200 will automatically result in a lower limit of 1700.
If both limits are not linked, the lower limit will keep its value of 1000 when changing the upper limit.
(2) Diagram in the tool window
In live mode, the tool window's diagram displays the intensity histogram of the resulting snapshot. The intensity histogram is automatically computed by the software. After the acquisition of the snapshot, the snapshot's actual histogram is displayed.
The histogram shows the intensity distribution by plotting the amount of pixels against the intensity. Therefore, it shows how many pixels are present in the image, and their intensity.
In the histogram, you can additionally see two vertical lines. In the image window, only those intensity values will be shown, that lie between these two vertical lines.
Information about the histogram
Below the diagram, some information about the histogram is shown. These values always apply to the histogram of the current image. Where a multi-dimensional image is concerned, the values apply to one individual image.
•The values Min and Max correspond to the lowest and highest intensity values.
•The Mean Intensity field corresponds to the mean intensity value. Only those intensity values will be considered, that lie between the vertical lines. With a multi-dimensional image, for example with a time stack, the mean value is recalculated for each frame.
•The Pixel Count field shows the number of pixels that lie between the two vertical lines.
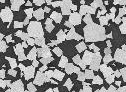
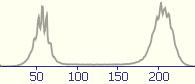
 Histogram of a gray-value image
With a gray-value image, the histogram shows the intensity distribution in the image.
 Histogram of a time stack
With a time stack, the histogram that is shown will always be that of the frame that is currently on display in the image window.
(3) Auto Contrast / Fixed Scaling
Auto Contrast
The Auto Contrast option is automatically selected when you activate live mode. With the Auto Contrast option, your software automatically determines the image's smallest and greatest intensity values. The range between the smallest and greatest intensity values will be divided up into 256 parts and displayed in the image window. The automatic contrast ensures that the image is displayed optimally on the monitor, independently of the current exposure time.
If you have selected the Auto Contrast option, you can set up an "overflow". The Left and Right values go into the calculation of the minimum and maximum values. For example, a value of 3%, means that the darkest pixels (where the left overflow is concerned), or the brightest pixels (right overflow) will be displayed in black or white.
You can also alter the overflow directly in the histogram. To do so, click on one of the vertical lines and drag it to the required position.
The change in the overflow is automatically adjusted in the live-image. When you acquire a snap, this change is applied to the snapshot.
If you want to change the overflow directly in the snapshot, enter the minimum and maximum values and click the Apply button to have the new values computed. The display in the image window is correspondingly adapted.
Click the Default button to restore the default settings. You can change the default settings in the program options. To do this, use the Tools > Options... > Images > Default Display Settings command.
Fixed Scaling
Select the Fixed Scaling option if you want to manually determine which range of intensity values is to be displayed.
Use this option, for example, when you want to compare the intensities of several images on your monitor. That is only possible when all of the images are displayed in the same way.
Enter the minimum and maximum values you want, directly in the Left and Right fields. The maximum possible value is the highest intensity value that is possible for this type of image. For a 16-bit gray-value image, the smallest possible value is 0 and the largest is 65535.
You can also alter the minimum and maximum values directly in the histogram. To do this, move the mouse pointer over one of the two vertical lines. Once the mouse cursor changes its shape - into a ‘double-arrow’  , keeping the left mouse button depressed, you can move the line to where you want it.
Click the Default button to restore the default settings. With a snap, the Auto Contrast button is automatically selected.
Displaying 16-bit images in the image window
The settings in the Histogram group are especially relevant for 16-bit images, since with 16-bit images, as a rule, it's not possible to display all of the information in the image window.
In the image window, only 256 intensity values can be displayed. Every pixel in a 16-bit gray-value image can, however, take on one of 65536 gray values, or, 16 bits of gray value. Therefore, to be able to display a 16-bit image in the image window, you must first establish which intensity values are to be displayed and how they are to be displayed.
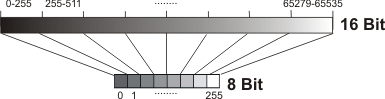
The illustration shows you how a 16-bit image's intensity values can be adopted in an 8-bit image. The upper bar contains the 16-bit image's intensity values. The lower bar contains the 8-bit image's intensity values. The 16-bit image contains far more intensity values than the 8-bit image. For this reason, the 16-bit image's intensity values will be divided into 255 parts, and each of these parts will be allocated one of the 8-bit image's intensity values. The illustration shows that in this process a large number of intensity values have to be mapped to one single value.
Displaying time stacks in the image window
With a time stack, there are two possible ways of calculating the automatic contrast. By default, the histogram of the frame that is currently on display in the image window will be evaluated for the calculation. From this histogram, the smallest and greatest intensity value will be determined.
You can, however, have all of the frames taken into account when the automatic contrast is set. Select the Histogram of all frames check box to have the intensity values for all of the individual frames summed up for the histogram's calculation. Then the automatic contrast will be calculated on the basis of this histogram.
(4) Histogram of all frames
The Histogram of all frames check box is only relevant if the active image is a time stack, and the Auto Contrast option has been selected.
Clear the Histogram of all frames check box. Now, the automatic contrast will be set in such a way as to optimally display the frame that is currently on display in the image window.
Select the Histogram of all frames check box to have the intensity values for all of the individual frames summed up for the histogram's calculation. The automatic contrast will then be calculated on the basis of this histogram.
00044 25032014