In the histogram, the number of pixels is plotted against the intensity. That is to say, it shows how many pixels are present in the image, with which intensity, or also the intensity distribution in the image.
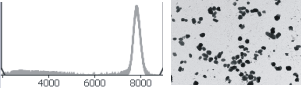
The histogram shown above shows the intensity distribution of the 16-bit gray-value image shown next to it. The intensity peak in the high gray value shows that the light background forms a large part of the image.
Live histogram
In the live-image, the online histogram shows the intensity distributions during the image acquisition. The online histogram will be continually updated. You can view the online histogram in the Adjust Display tool window.
The online histogram is therefore a good control of whether or not the image is well illuminated. In an image that is overexposed the intensity distribution will be cut off on the right-hand side. If the image is underexposed, the distribution will be shifted strongly to the left.
00126 17042013