Use the Chart dialog box to set the appearance of individual charts. The settings will only apply to the active chart. You can open this dialog box via the context menu. To do so, right click in the active chart's document window, then use the Chart Options > Chart > Display command.
Note: The appearance of a chart will be saved together with the chart file.
See also
Description of dialog box
Setting the chart title and the labeling of the axes
You can change the labels for the chart and for the axes however you like. The labels that are automatically assigned arise from the data that is displayed in the chart.
Example: Use the Line Profile tool window to measure the intensity profile along a line on an image and export the line profile to a chart document. The chart's name is Line profile: <Name of the image on which the line profile was measured>. The X-axis is labeled with the unit of length, [µm] for example. The Y-axis is titled Gray Value.
Click the Chart title field and enter a new name. The chart's name will be changed correspondingly.
Click the X-Axis title field and enter a new name for the X-axis.
Click the Y-Axis title field and enter a new name for the Y-axis.
Setting the background color
You can assign two different background colors to a chart.
Click the Inner background color field to open a color table. You can select one of 16 possible colors in the color table.
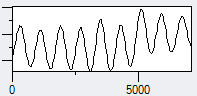
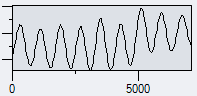
The illustration shows a chart with different background colors.
Click on the Outer background color field to open a color table with 16 different colors. Select a color.
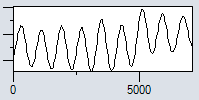
The illustration shows a chart with different background colors for the chart's document window.
Select the Default Colors check box to use the preset background colors. The color tables for the definition of the background color are now grayed out and can no longer be used.
Showing a grid
Select the Show grid check box to lay a line grid over the chart. The lattice spacing is preset and cannot be changed.
Clear the Show grid check box to fade out the grid.
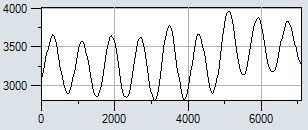
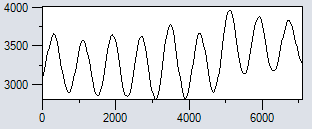
The illustration shows a chart with a grid over it and without a grid over it.
Showing a legend
Select the Show legend check box to display the legend on the right. The contents of the legend depend on the function that you used to create the chart.
Clear the Show legend check box if you do not want to have the caption displayed.
Restoring default settings
Click the Default display style button to have the personal default settings from the Options > Chart > Display dialog box copied to this dialog box. The current chart will be updated correspondingly.
1771 23012015