|
The Horizontal Line measurement object is used solely for the measurement of charts. It measures the distance between two interactively determined points.
 Creating a chart Creating a chart
Your software has its own chart document. A chart can be saved, edited and also measured.
Use for example the Line Profile tool window to have the intensity profile along a line displayed on an image. Click the Export to Chart  button to export the line profile to a chart. As soon as a chart has become active in the document group, the Measurement tool window changes its appearance. From then on, only the measurement functions that you can use for charts are available. button to export the line profile to a chart. As soon as a chart has become active in the document group, the Measurement tool window changes its appearance. From then on, only the measurement functions that you can use for charts are available.
Measuring on charts
Click the Horizontal Line  button. Now measure the distance between two points on the chart in the diagram window. To do so, click the start point and end point of the measurement in the diagram window. The measurement results will be shown in the Measurement tool window. button. Now measure the distance between two points on the chart in the diagram window. To do so, click the start point and end point of the measurement in the diagram window. The measurement results will be shown in the Measurement tool window.
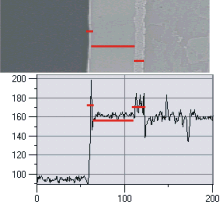
The illustration shows the intensity profile of a sample that is made up of several layers. You can clearly recognize the different layers in the intensity profile. On the intensity profile, several horizontal lines have been measured.
Above you can see the corresponding image segment of the sample.
See also
Multiple Horizontal Lines
Tool Window - Line Profile
1922 11032014
|